Explainer
How do I practise liquidity sweeps and fair value gaps on a replay?
Mark a prior high with a ray, step until a candle takes it and closes back, box the three-candle gap that follows and journal each with a tag.
Updated
The short answer
A replay lets you find these two shapes as they form, one candle at a time, and mark them before you know what comes next. The Trade Lab has the tools for it: horizontal rays, boxes and a journal with tags.
This walkthrough uses NQ on Thursday 2025-08-07 (contract NQU5). It defines both terms in plain words and shows how to mark and log them. It does not say that either shape predicts anything.
- Liquidity sweep
- A candle whose wick trades beyond an earlier high or low and then closes back on the other side of it. This guide uses the overnight high.
- Fair value gap
- Three candles in a row where the first candle’s low is above the third candle’s high (a gap down), or the first’s high is below the third’s low (a gap up). The gap is the price range no candle traded across.
Mark, step, log
Mark the level first
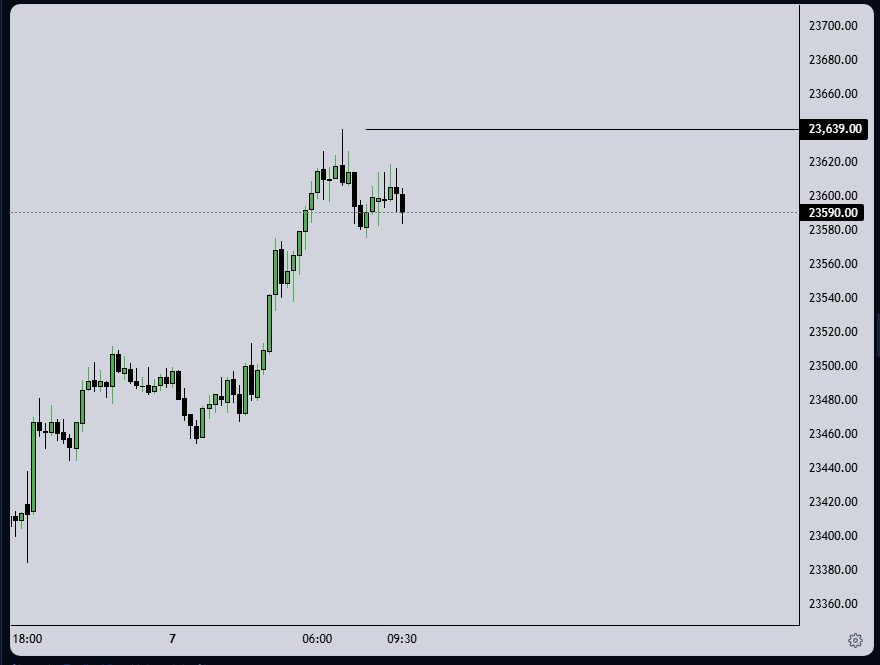
Jump to 09:30, switch to a 15-minute chart and draw a horizontal ray at the overnight high, 23,639.00. Marking it before the open means you are not choosing the level with hindsight.
Step until a candle takes it
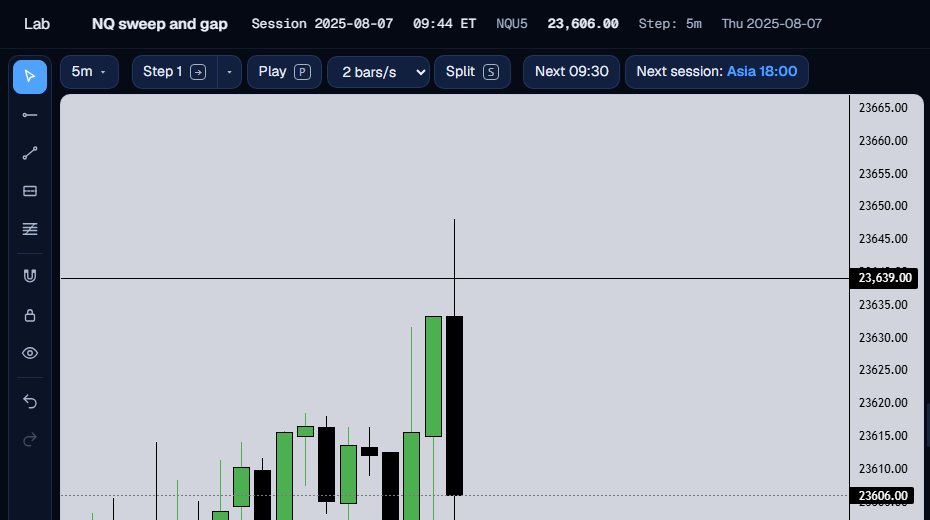
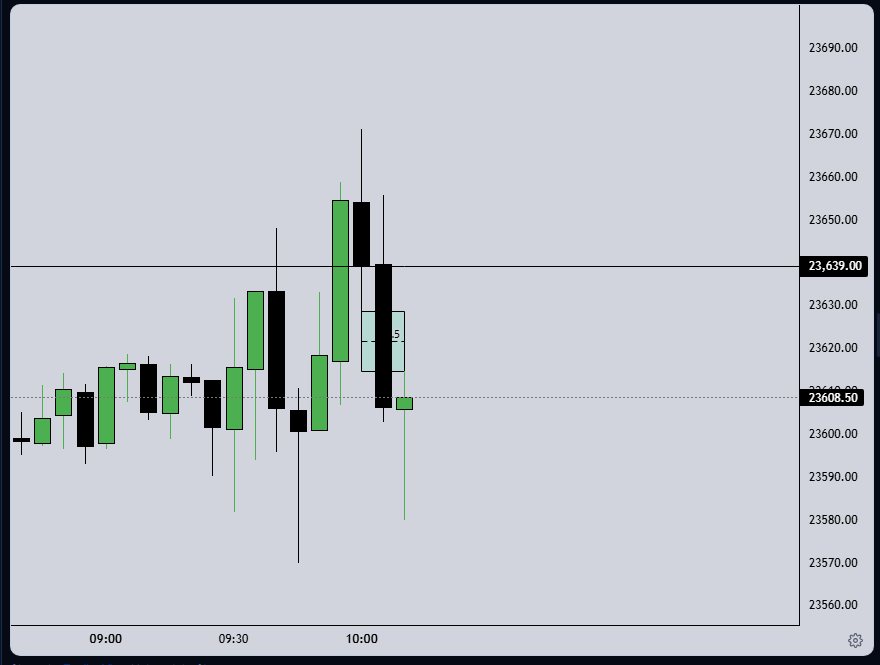
Back on 5 minutes, step one candle at a time. At 09:44 the 09:40 candle has a wick above 23,639.00 and closes below it. That is the sweep, as defined above.
Keep stepping until a gap forms
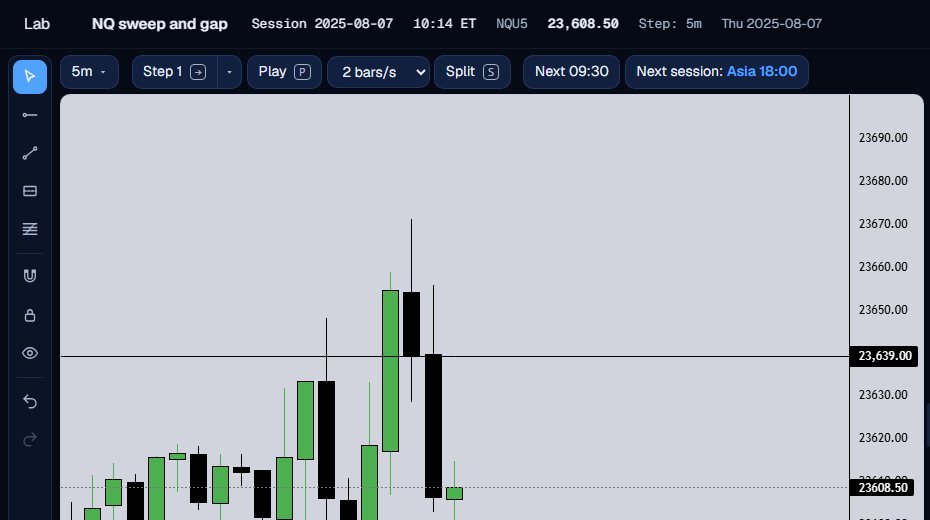
Step on. By 10:14 the 10:00, 10:05 and 10:10 candles have formed a gap down: the 10:00 candle’s low is 23,628.50 and the 10:10 candle’s high is 23,614.50.
Box the gap
Pick the box tool and draw it across the three candles, from 23,628.50 down to 23,614.50. The box shows where price did not trade.
Journal both with tags
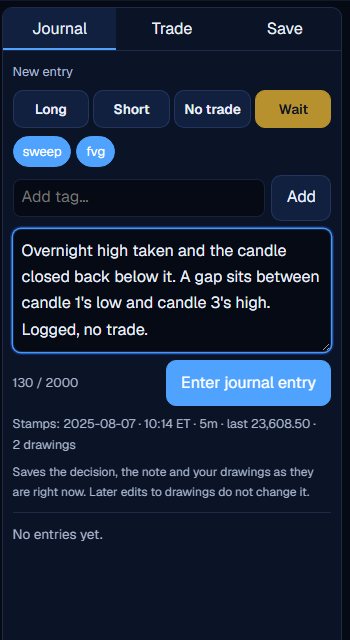
Choose Wait, add the tags sweep and fvg, and write what you saw. Saving also stores your drawings as they are at that moment.
Step on and review
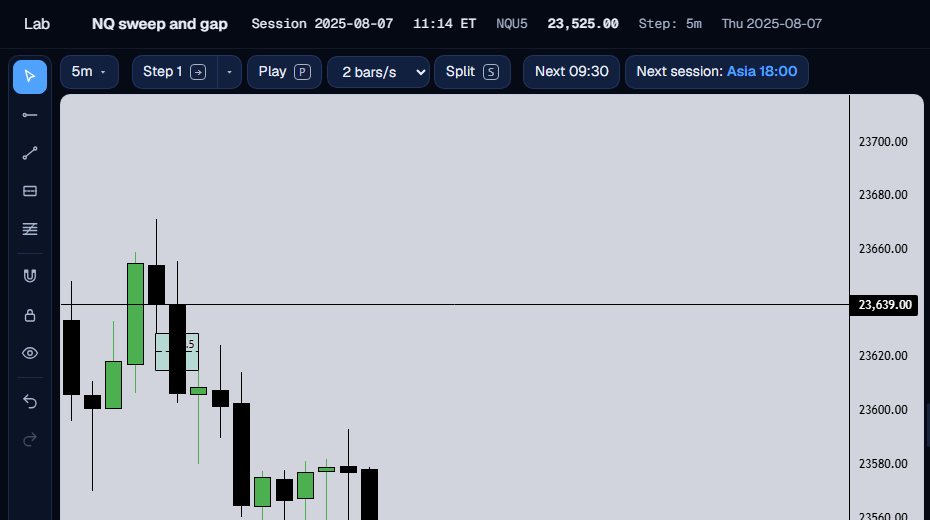
Step ahead and look at what followed, then compare it with your entry. Here twelve more candles reach 11:14.
Why journal each one
One sweep or gap tells you nothing. A set of them, logged the same way, lets you look back at how many you saw, which ones you marked early and what you did. Tags make that list easy to filter later.
Be strict with the definition. A wick that does not close back, or a gap that one candle’s wick fills, is a different shape. Deciding that before you start keeps the sample honest.
Define the shape in writing, mark it before the outcome, and log every instance, including the ones you skipped.
What the Trade Lab does not do
The Trade Lab replays history. It has no live data, and no real order is ever placed. Paper fills are modelled on 1-minute bars, so they approximate real fills.
Each account can read 40 distinct 1-minute sessions and start 5 new runs per UTC day, and it needs a verified email. The Lab itself is free.
Questions and answers
What is a liquidity sweep in simple terms?
A candle that pokes past an earlier high or low and then closes back inside. The wick takes the level, the close gives it back.
What is a fair value gap?
Three candles where the first candle’s range and the third candle’s range do not overlap, leaving a gap between them. Many traders box that gap.
Do sweeps and gaps predict direction?
This guide makes no such claim. It shows how to mark and log them so you can study your own sample.
Which Lab tools do I need?
A horizontal ray for the level, a box for the gap and the journal’s tags. All three are in the Trade Lab.
Can I mark the same shapes on ES or gold?
Yes. The tools are the same on NQ, ES and GC.